
Glad to be!
Whither Rent Regulation
The rent stabilization law that keep apartments affordable for millions of New Yorkers was just renewed, warts and all.
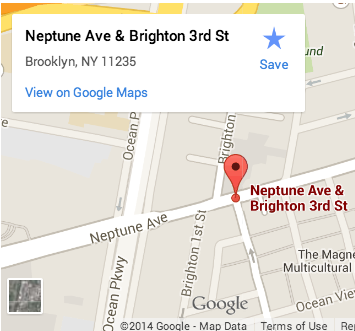
⅕ of NYC Collision Data Wrong
New York has really stepped up its open data game in the last year. Data sets like ACRIS (the city property records) and MapPLUTO (GIS) that used to cost thousands of dollars are now free. While it’s in beta with limited access, the city now makes available its official geocoder, too. This openness is drawing into harsh relief excctly how poor the quality of the city’s collision statistics are.

A YouTube CLI for Mac
Out of laziness, I mostly listen to music off YouTube these days. As a library it’s pretty unbeatable, and I don’t have to worry about plugging in an external HDD with a big library.
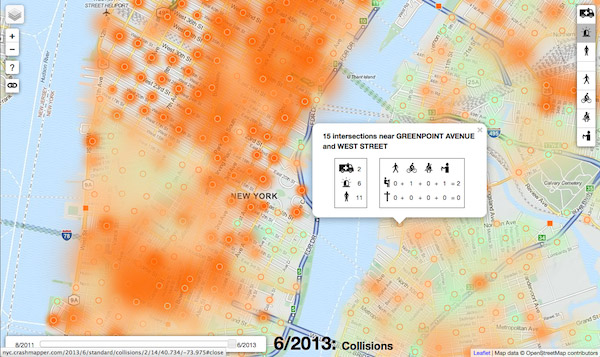
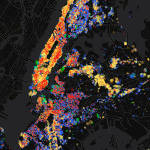
Introducing NYC Crashmapper
For over a year, I’ve been archiving and processing the New York City Police Department’s collision data on the Crash Data Band-Aid.
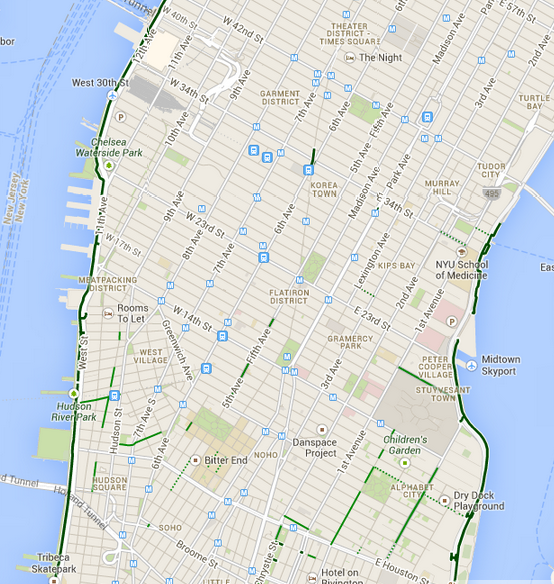
New Google Maps Mutilates Bike Layer
Anyone who bikes in New York City and uses Google Maps to look up their route is in for an unpleasant surprise.
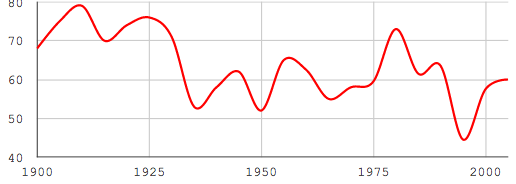
New NYC Buildings Less Efficient
Large buildings constructed in New York City since 1935 are by today's standards less energy efficient.

Preparing a Mac Laptop for Your Grandma
My grandma got a new laptop for Mother’s Day. She’s in her nineties, and first started using a computer a few years ago. Email, watching music on YouTube, and playing bridge online are now essential parts of her life. Her first computer was an old iBook, which still works fine, but the services she uses have rendered it unusable:

JS-Free Live Chat
I built a real-time web-based chat without a line of client-side code. No JavaScript, no Flash, no (ew) Java applet. 100% HTML. It even works in Internet Explorer 4, emulated with SheepShaver.

NYPD Crash Data Band-aid
Yesterday, Streetsblog wrote about the previous day’s New York City Council hearing on traffic safety. There have been several particularly gruesome incidents in the past year where New York drivers maimed and killed pedestrians and cyclists. The New York City Police Department has not only barely investigated the crime scenes, but it has been incredibly callous towards the victims, their families, and the press.